How to Plot Points on a Google Map
The easy way to plot points on custom Google Map.

In this tutorial, we’re going to demonstrate how to plot points on a custom Google Map.
To do this, we’ll use Atlist — a free, easy to use map maker.
Let’s do this!
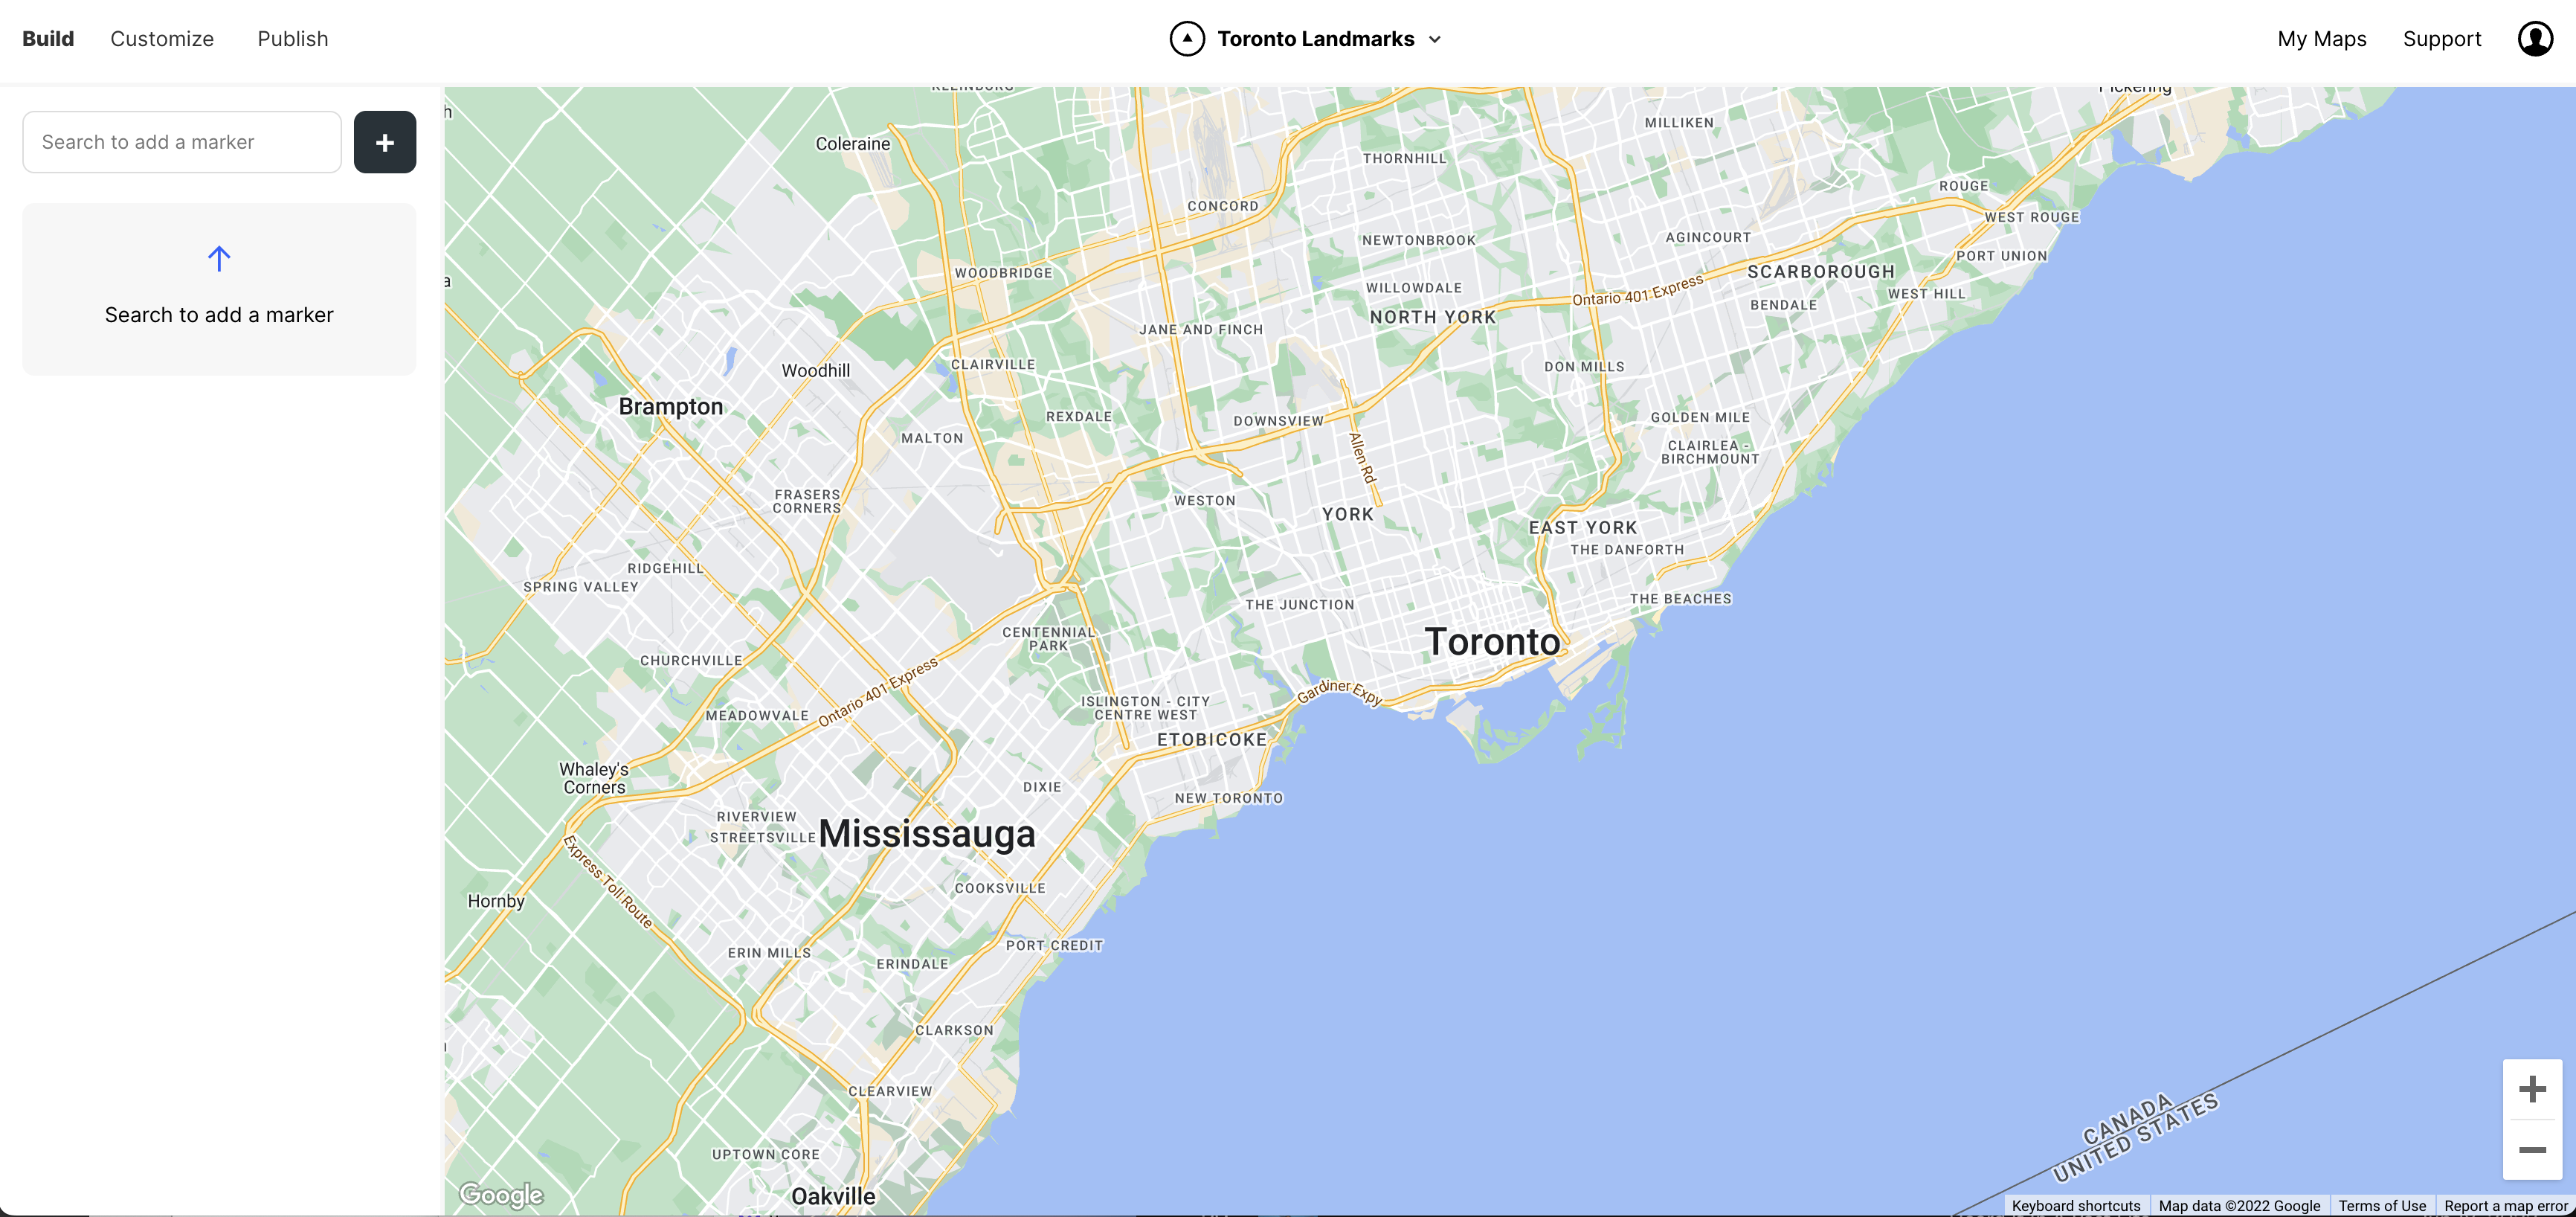
Step 1: Create a Map
After signing up for a free Atlist account, you’ll want to create a new map:
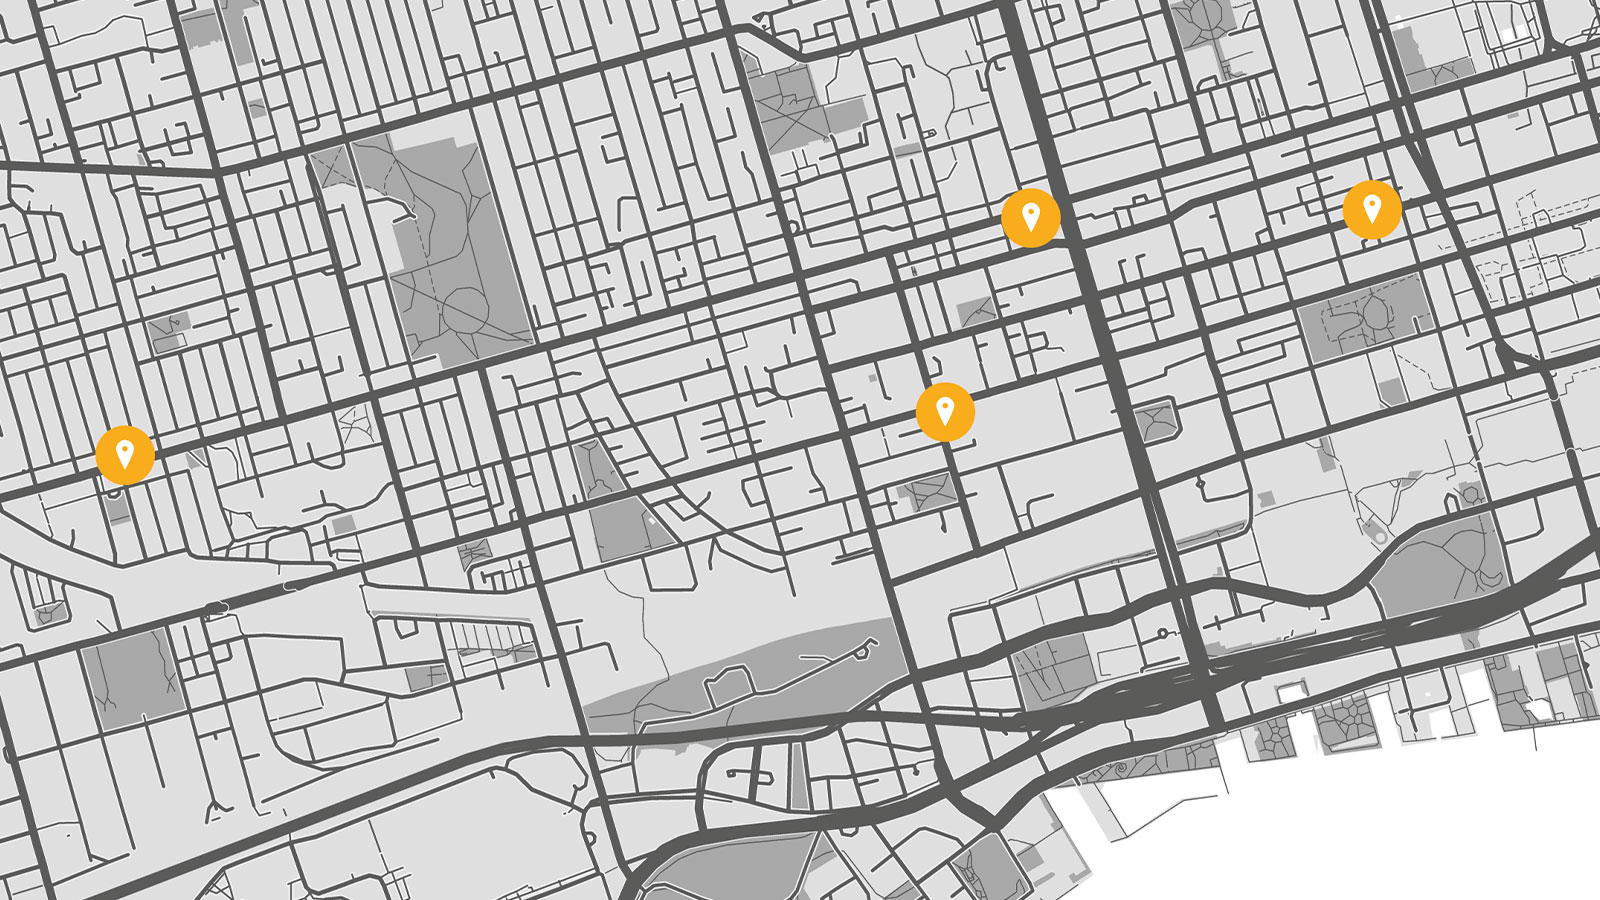
Step 2: Plot Your Points
To plot the point on your map, just type an address into the search box:
Once your point is added, you can also adjust the latitude and longitude (see how).
You can continue to add points this way or you can also upload a CSV spreadsheet.
Optional: Upload a CSV Spreadsheet
A CSV can be exported from any spreadsheet program — including Microsoft Excel, Apple Numbers and Google Sheets.
Here’s how to upload the spreadsheet with Atlist:

You’ll want your CSV datasets to be in the correct spreadsheet format and with required location data — basically each point needs an address or latitude and longitude.
Does this all sound complicated? It’s really not. Check out this tutorial on how to upload a spreadsheet to Atlist..
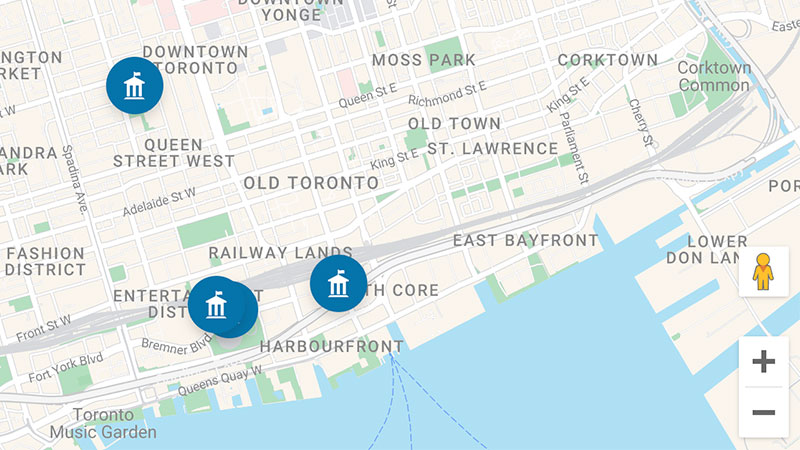
Optional: Organize Points into Groups
If you’d like, you can create groups and categorize points:
Groups can also have their own custom styles — read more here.
Step 3: Add More Info to Points
Once your points have been plotted, you can customize their modals.
Modals are like pop-ups for your points. They turn your map into an interactive map!
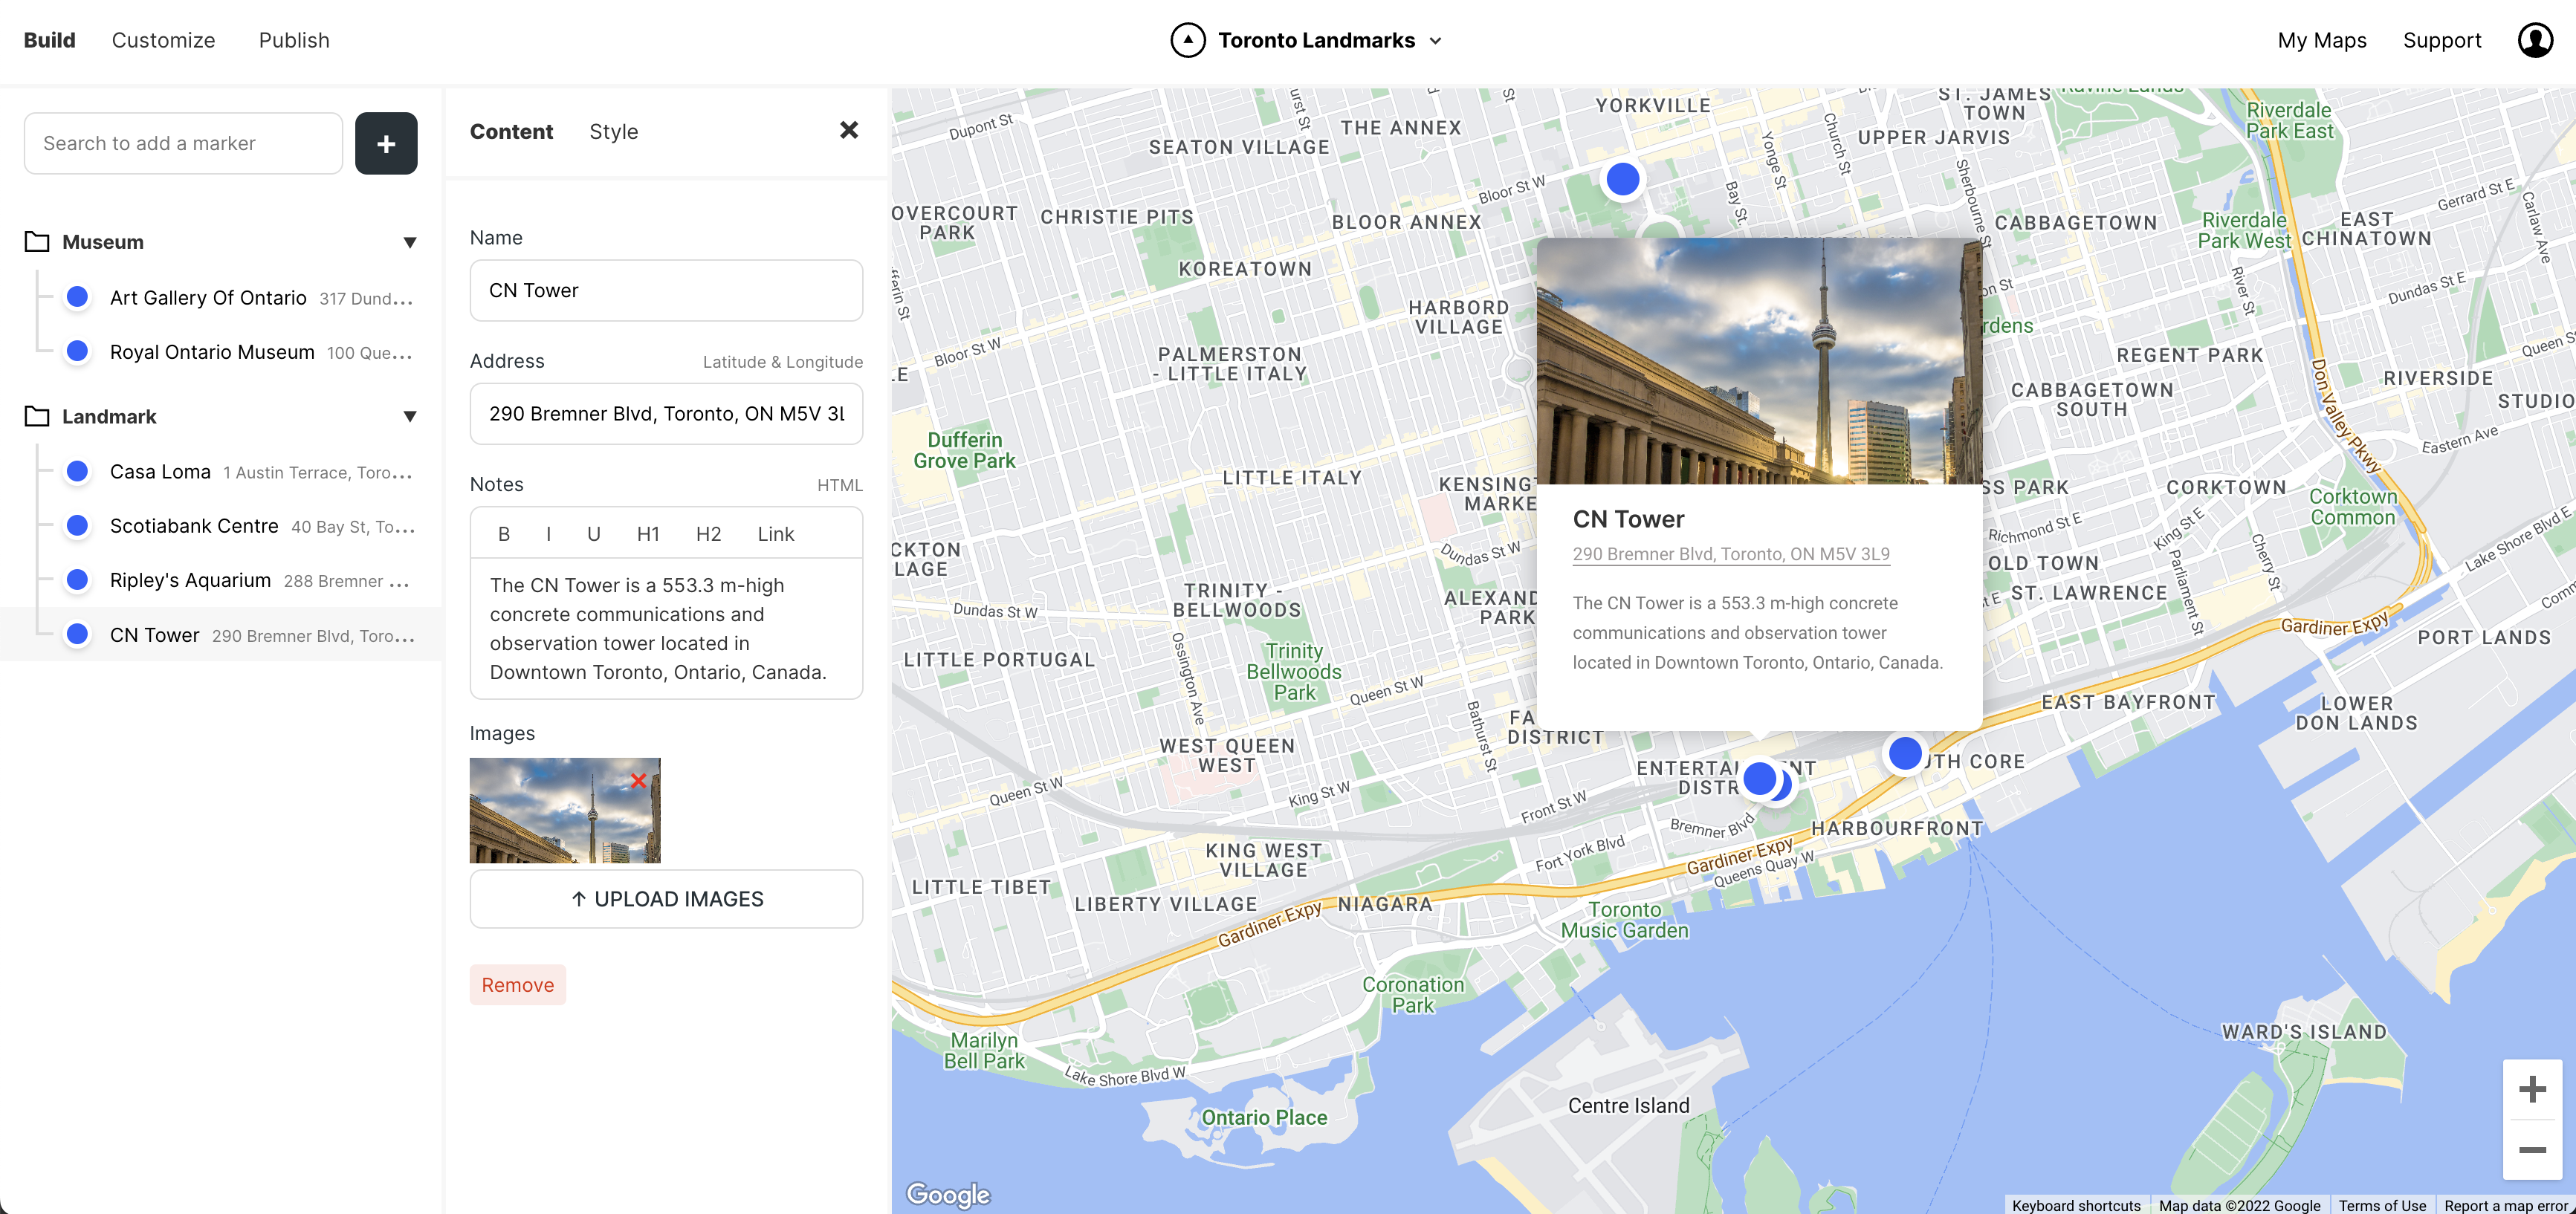
Modals are a great place for additional information. You can add just about anything: photos, operating hours, HTML, YouTube videos, Instagram posts — whatever!
Step 3: Customize Map Style
You can use Atlist to customize the style of just about everything with your custom map:
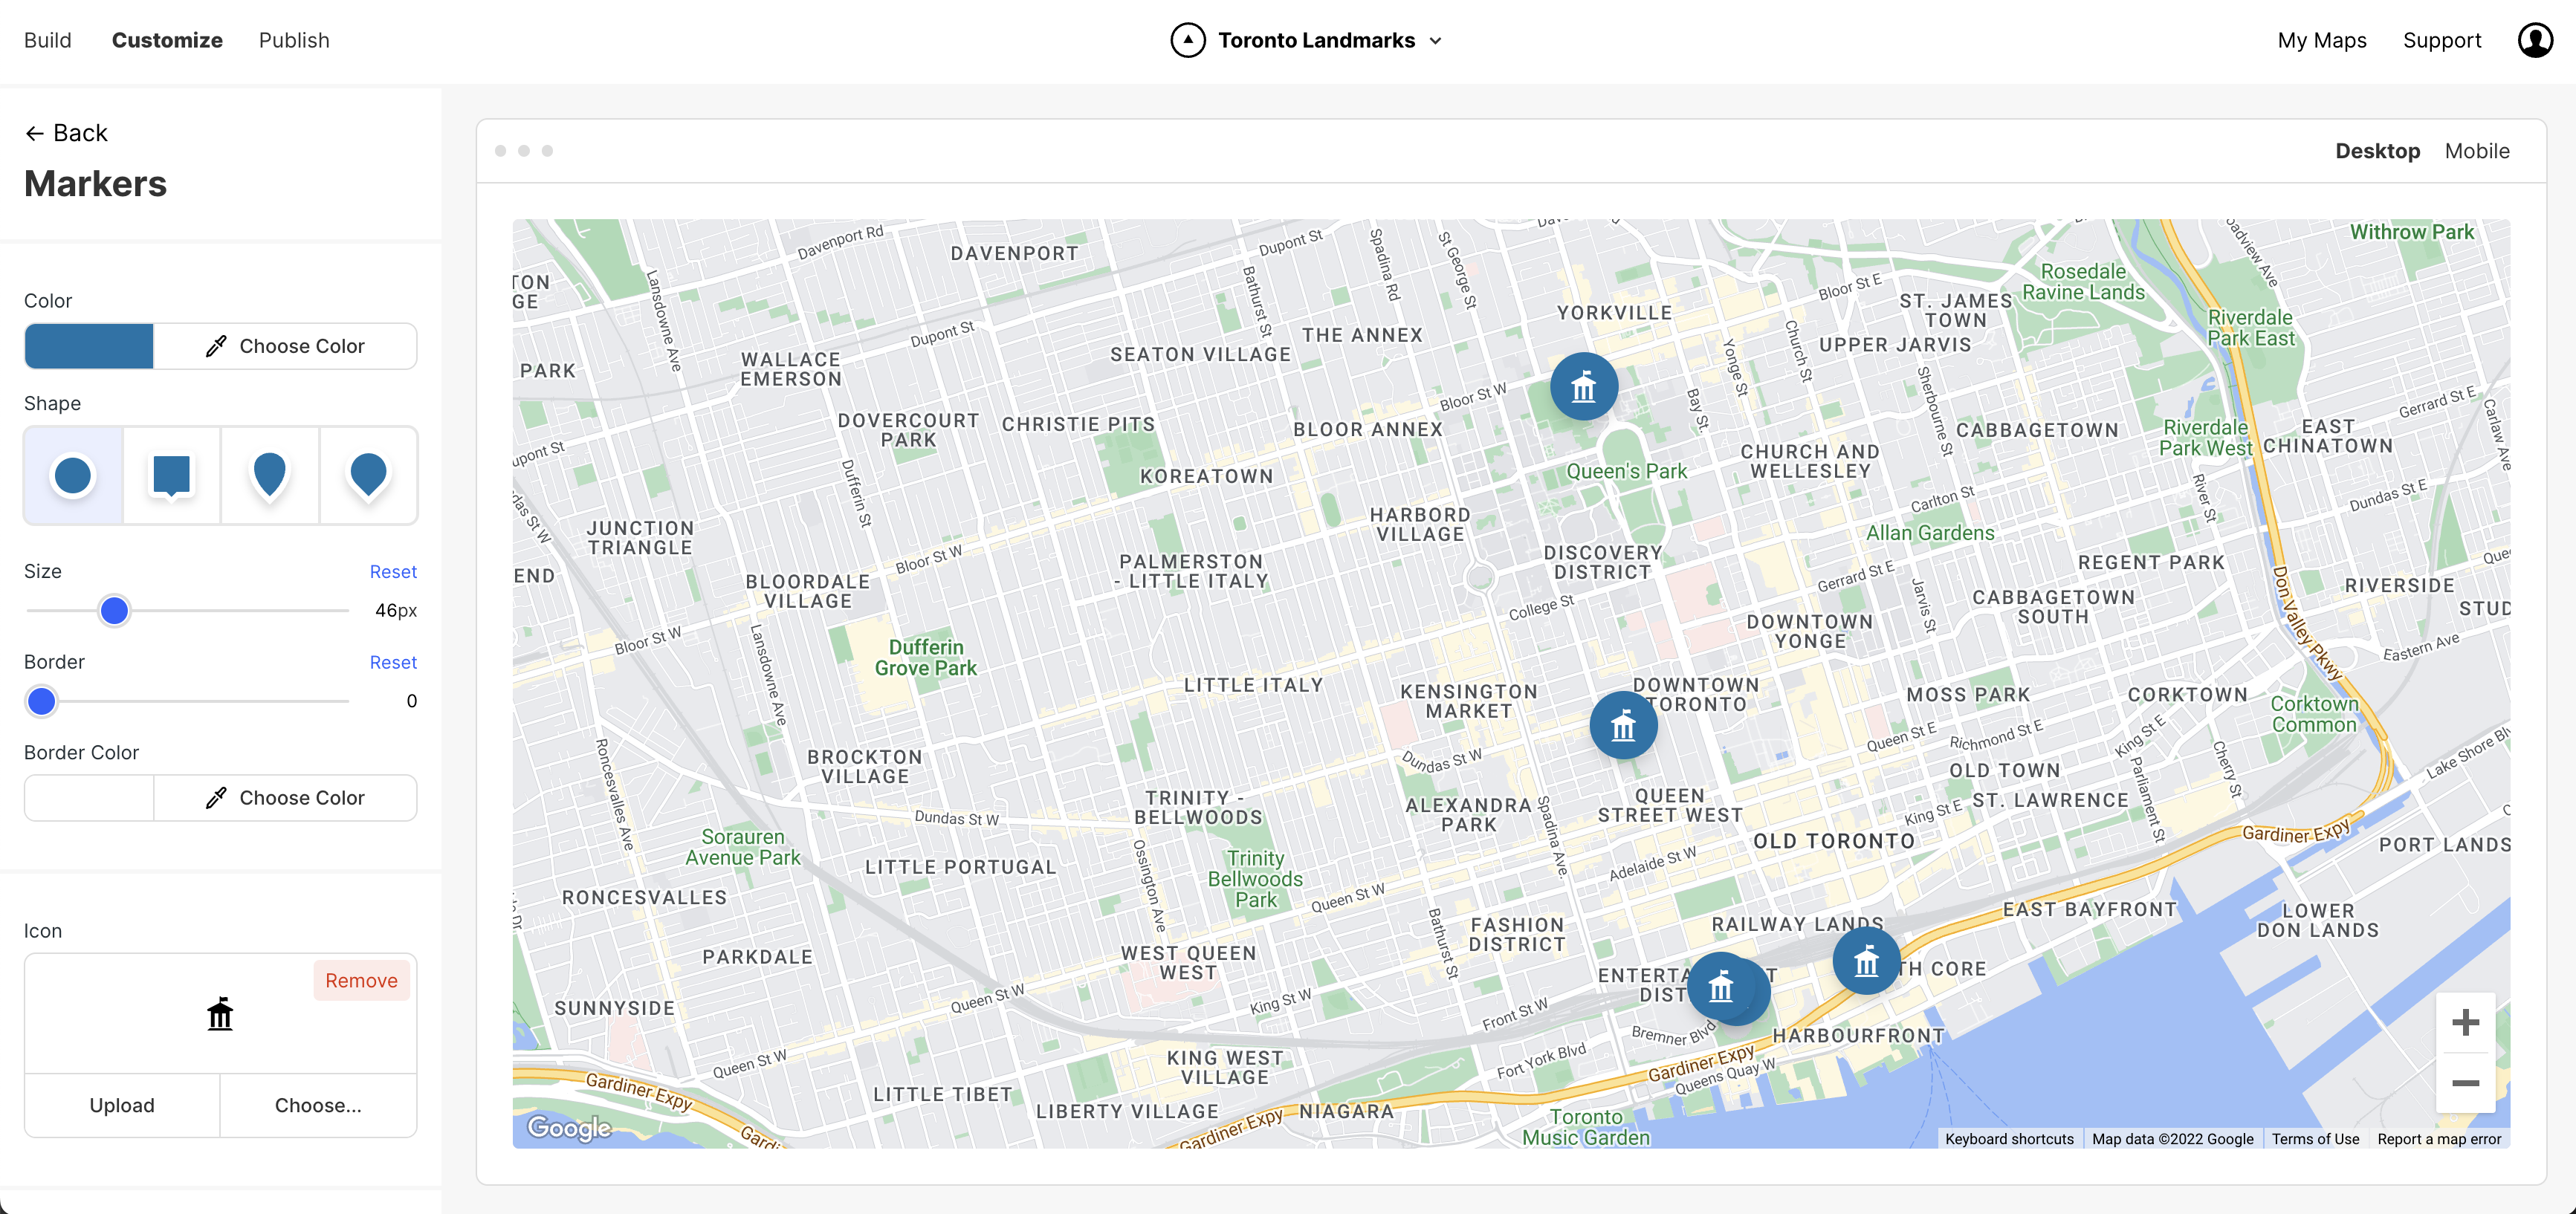
Markers
Customize the marker icon, size, color and more:
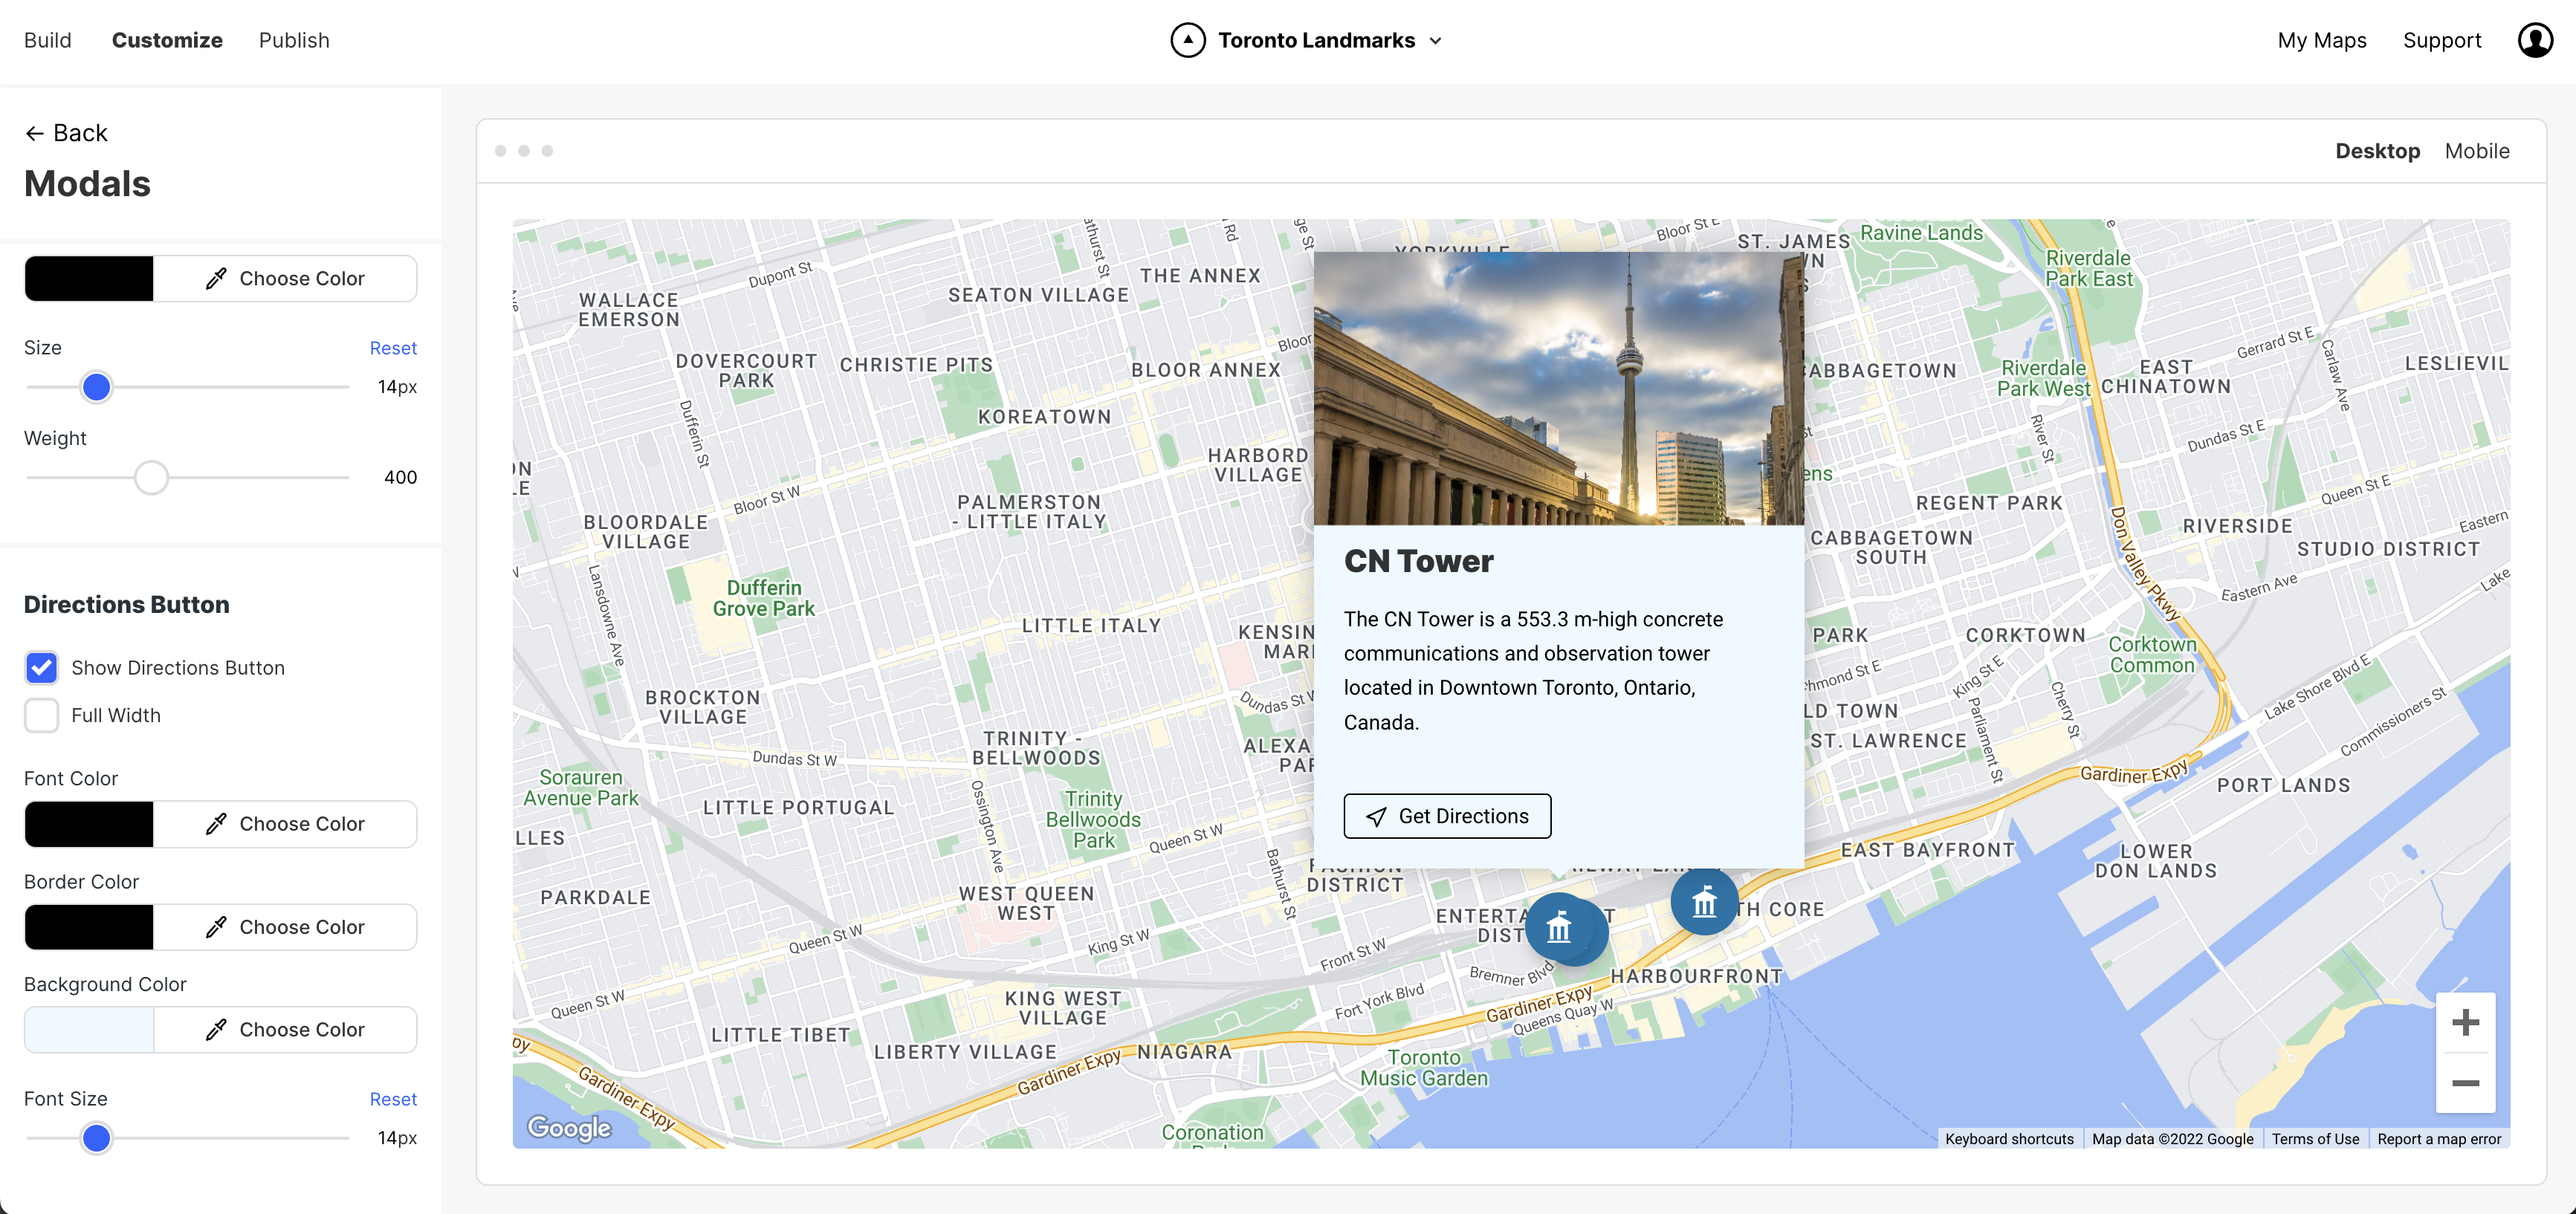
Modals
Customize the size, background color, fonts and more:
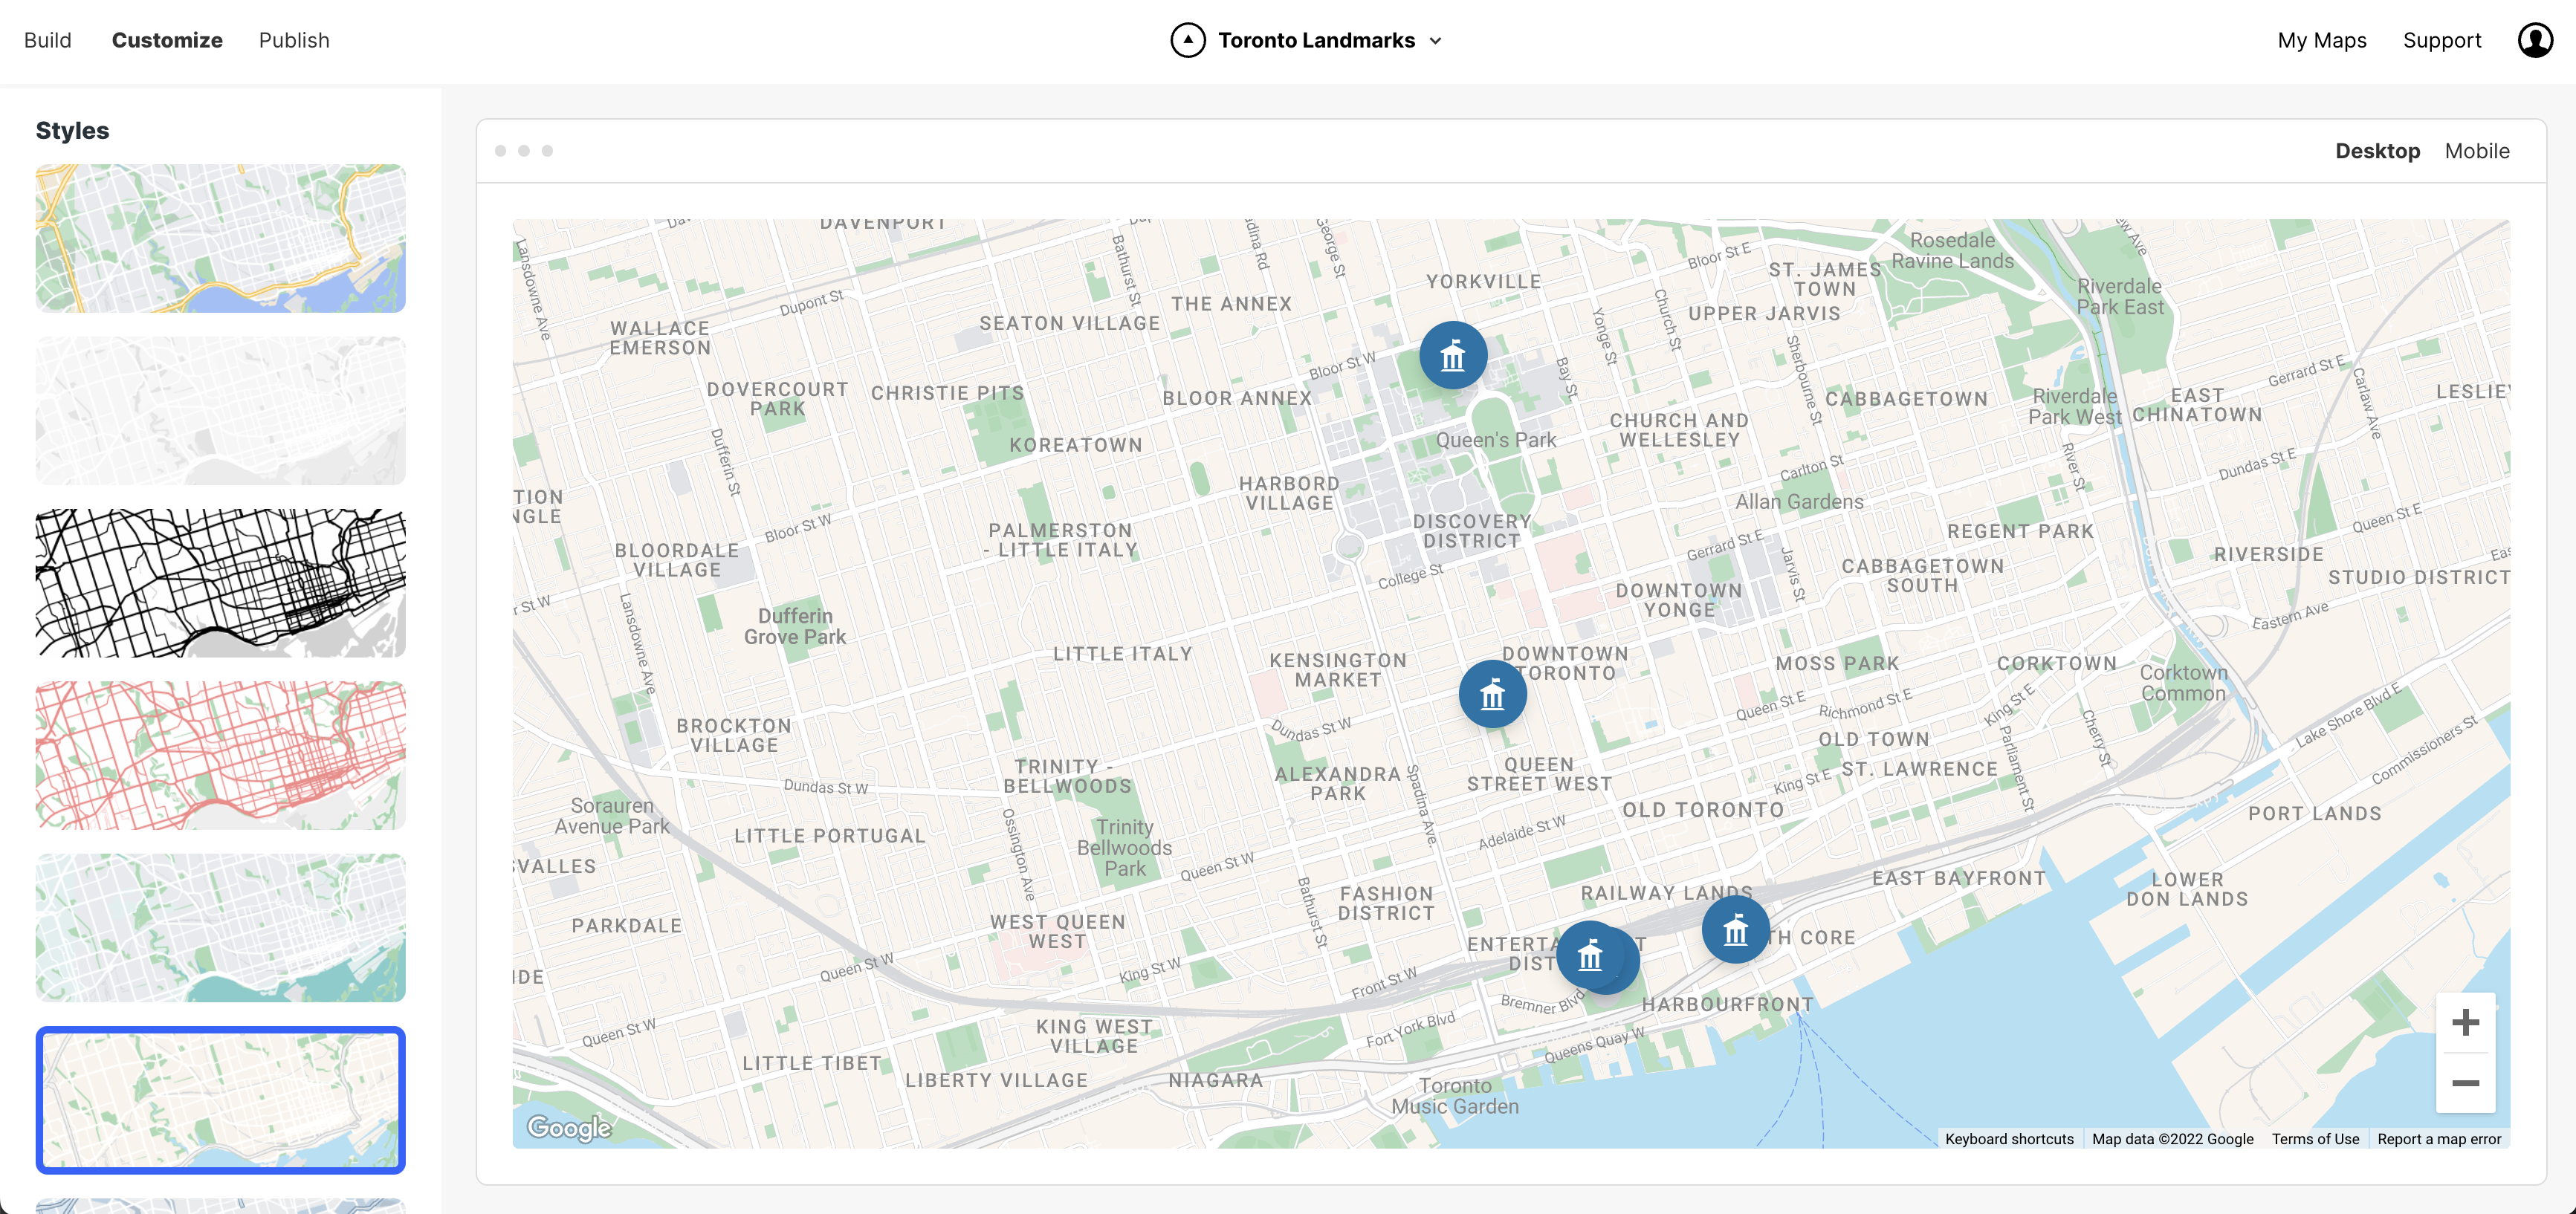
Maps
Choose from pre-designed map styles or customize the basemap style yourself:
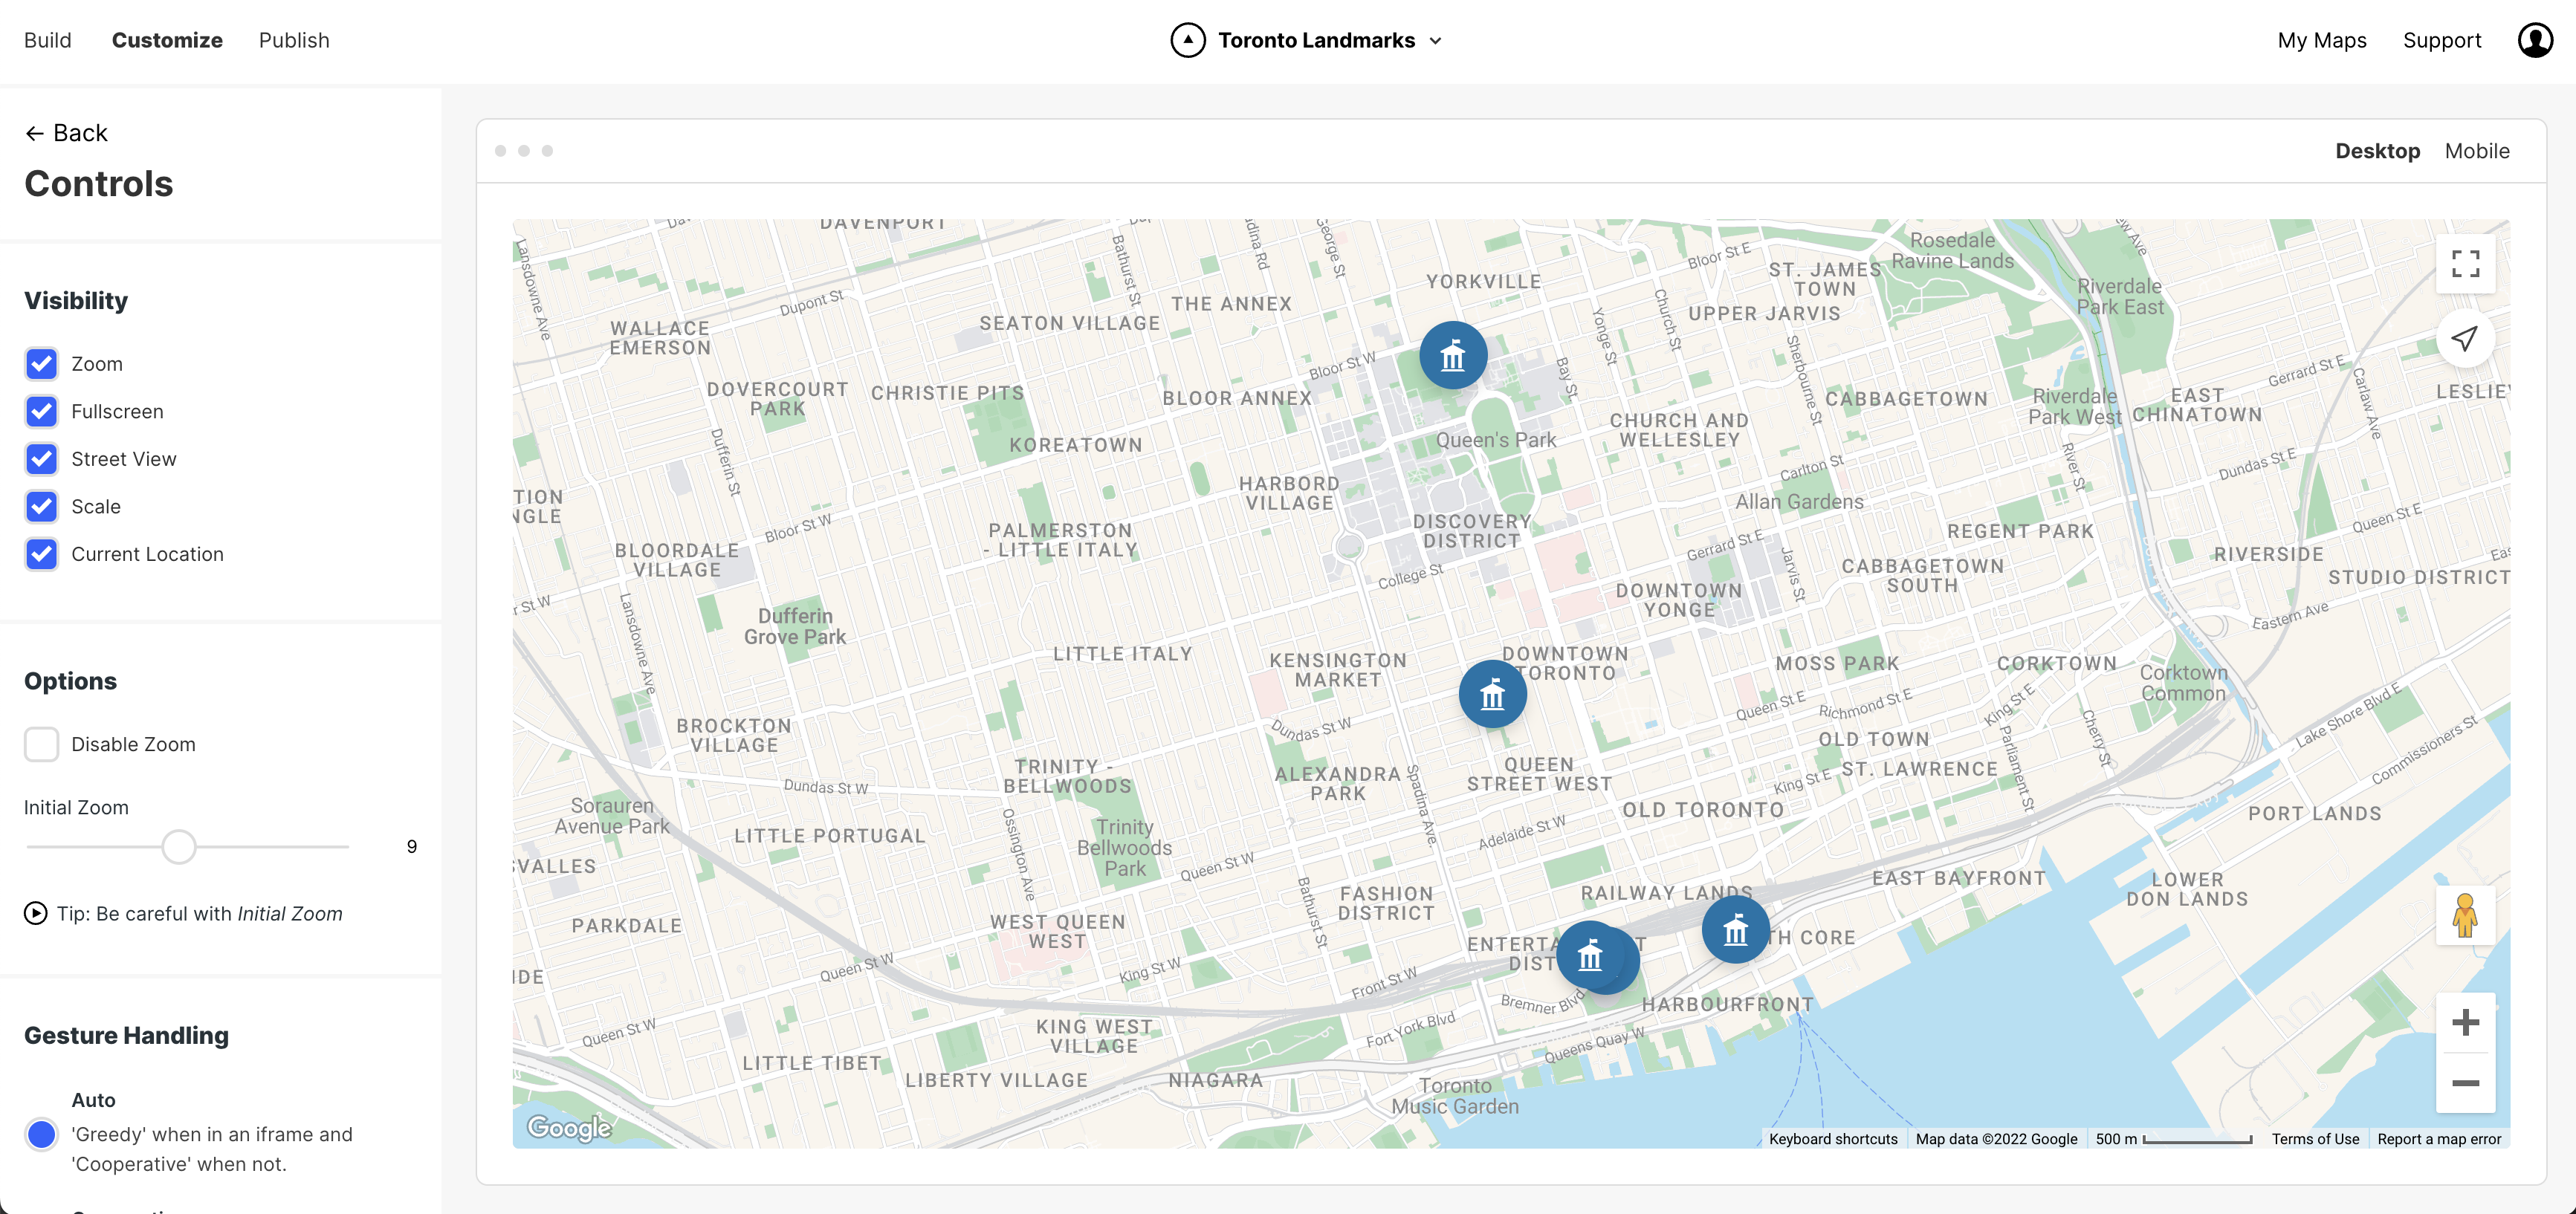
Controls
Add custom controls like zoom levels, street view, pan and even a button to show the users current location.
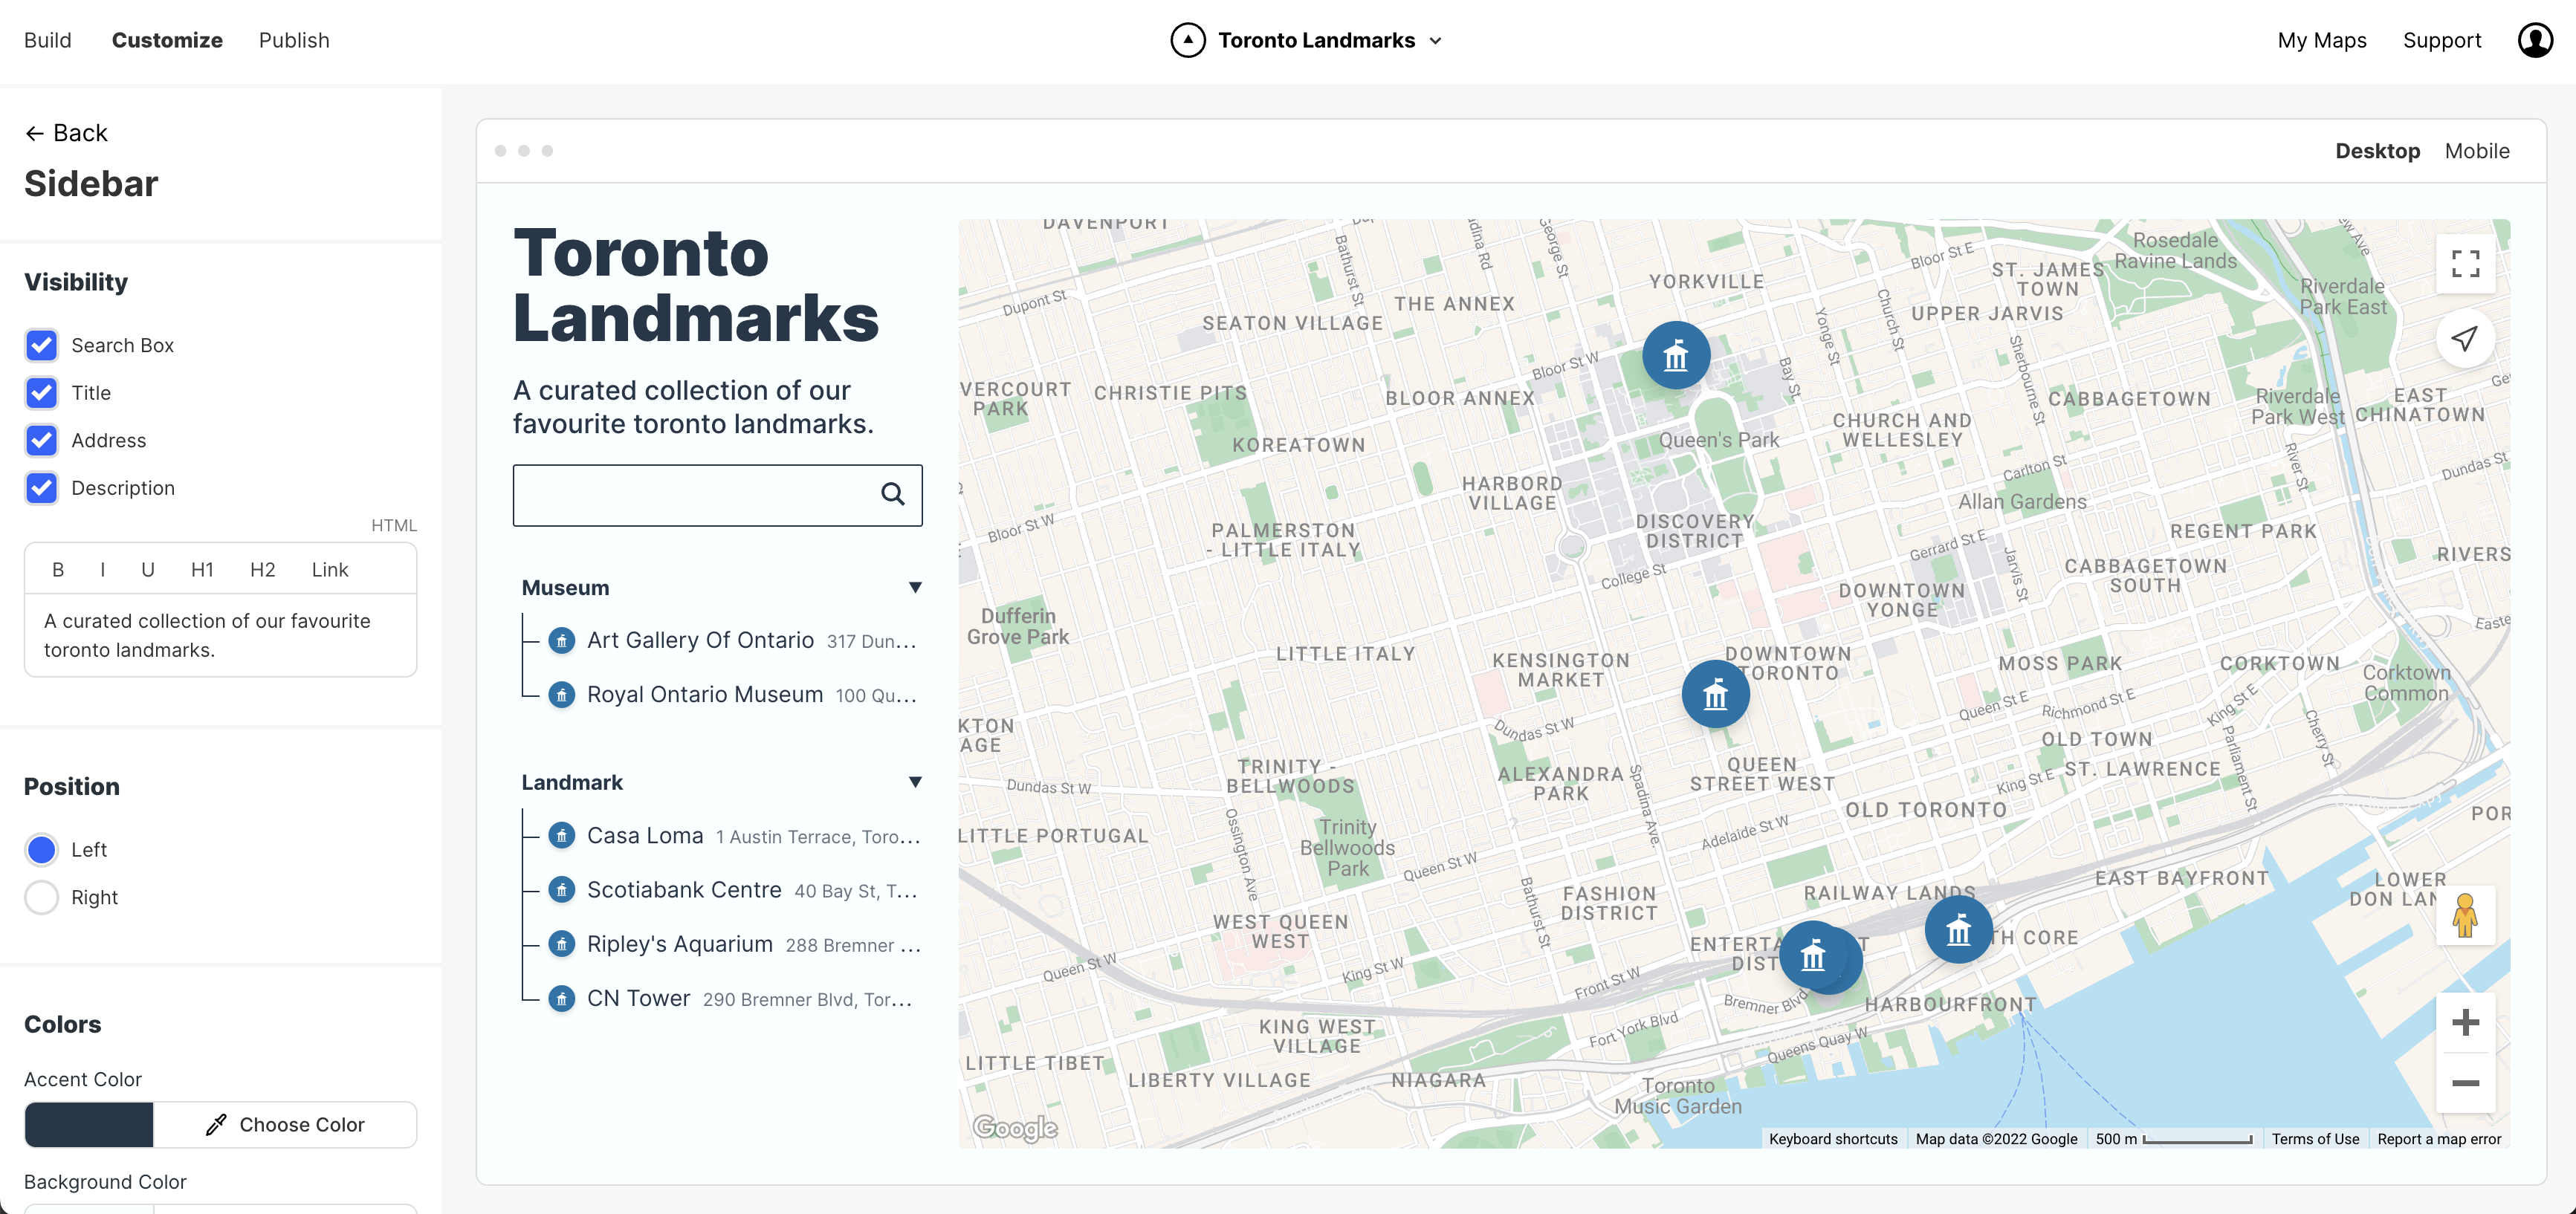
Sidebar
Add a sidebar with search, a list of points, title and description.
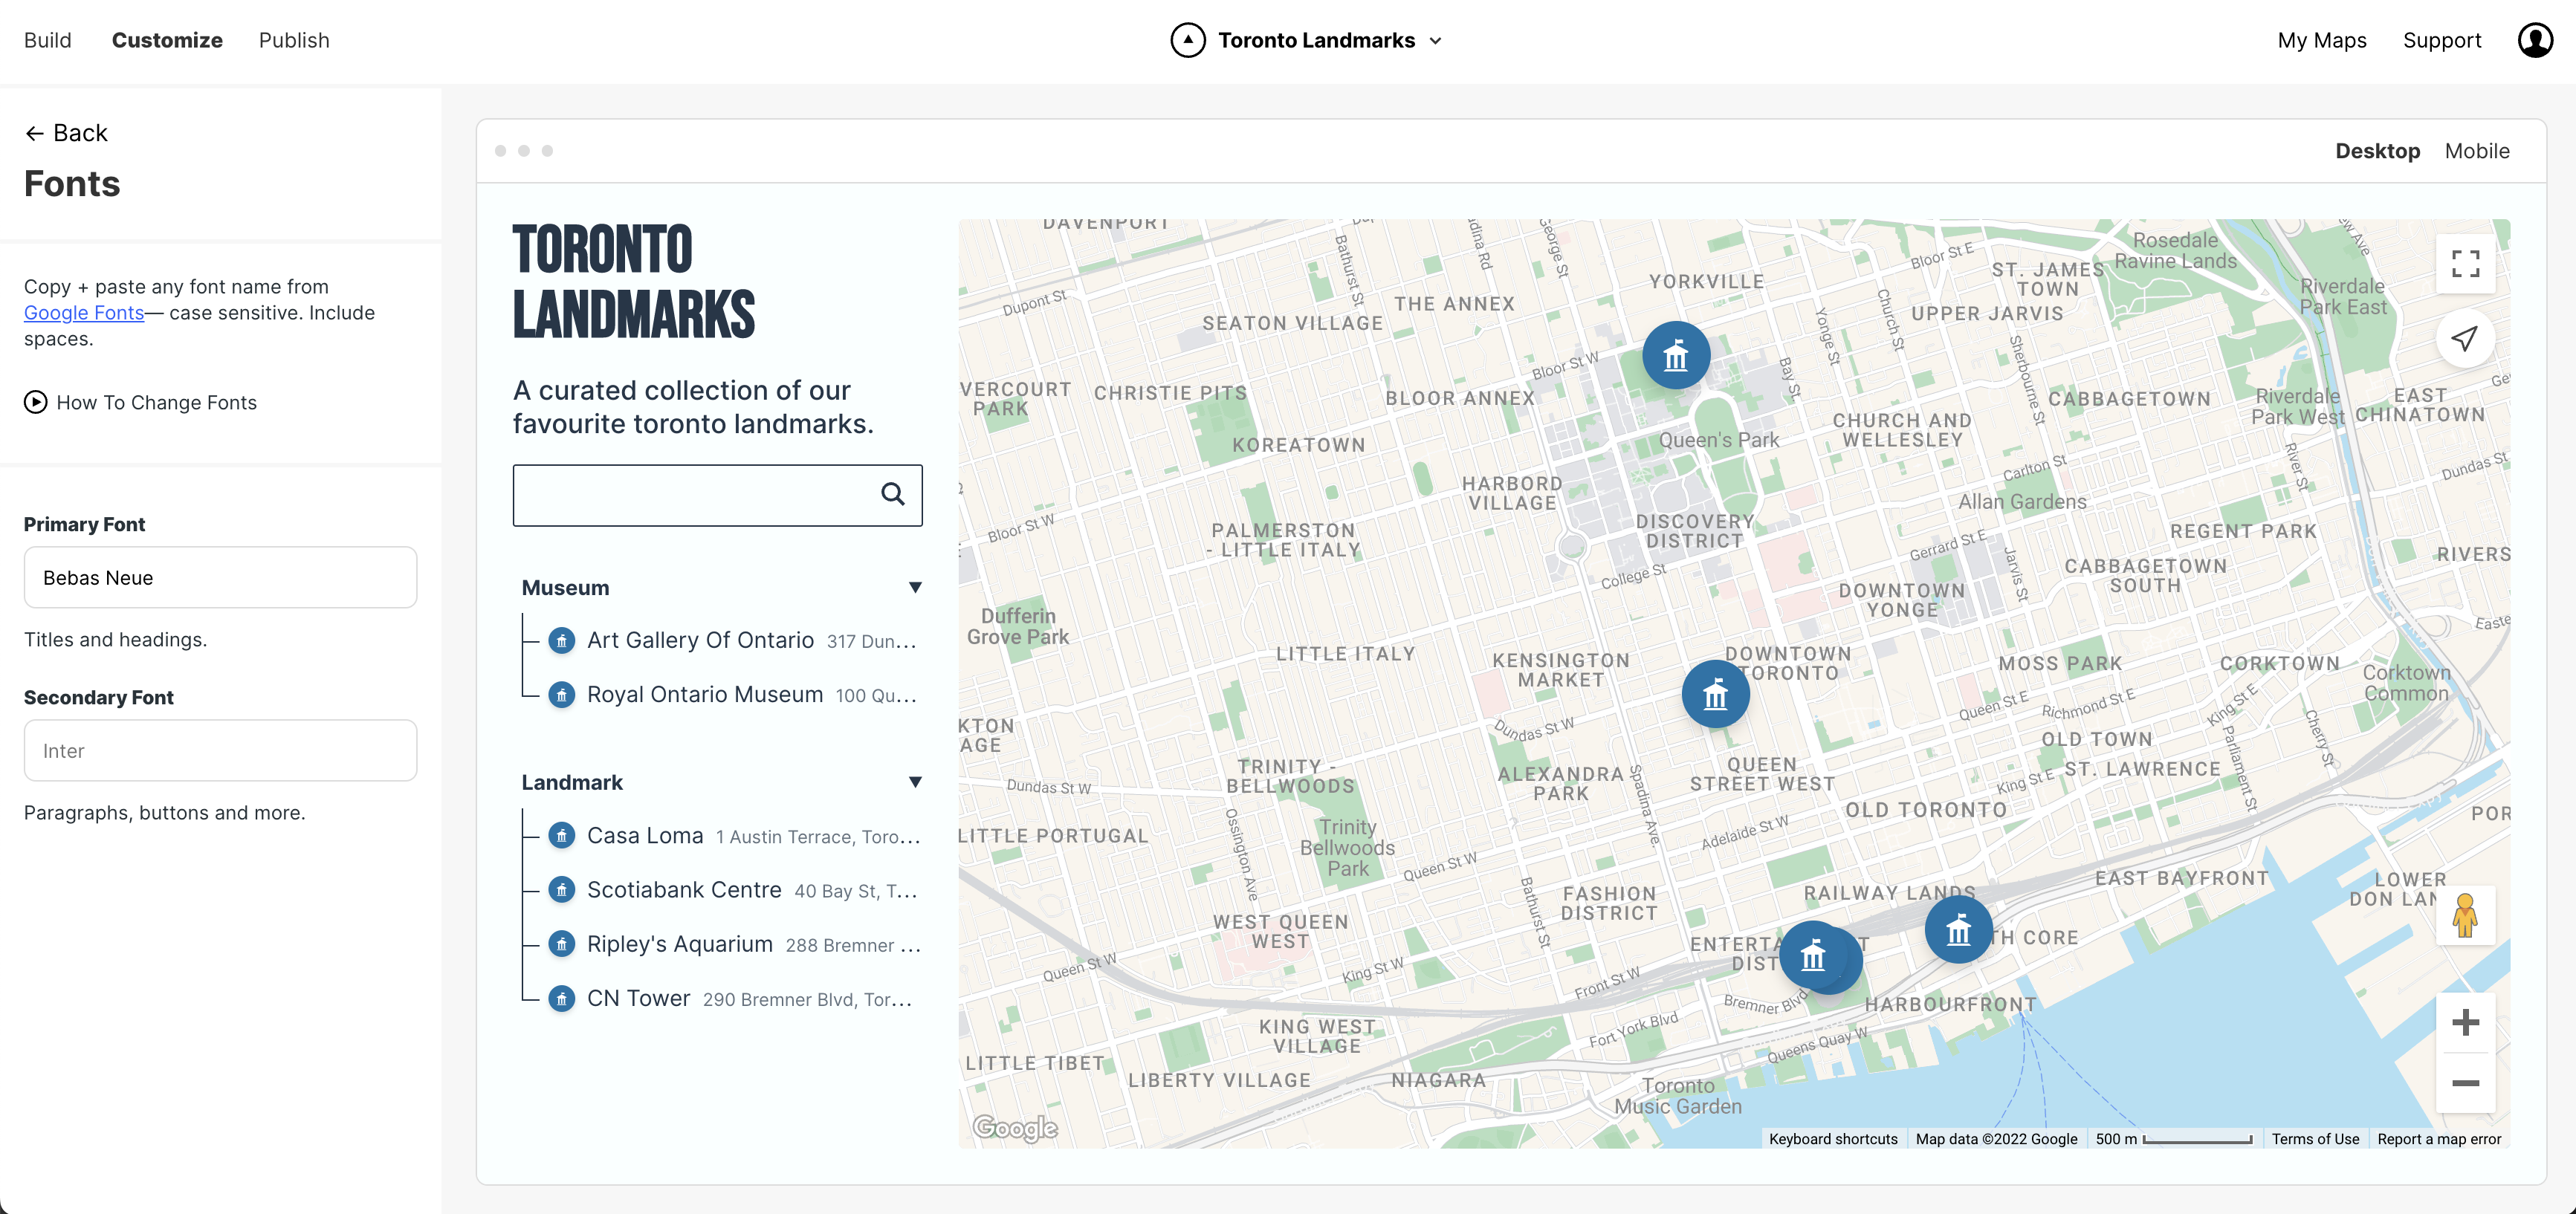
Fonts
You can even choose custom fonts for your map!
Step 4: Publish Your Map
You’ve plotted your points and styled your map — now it’s time to publish the map!
You can share your map by URL, embed it on a website or save it as an image:
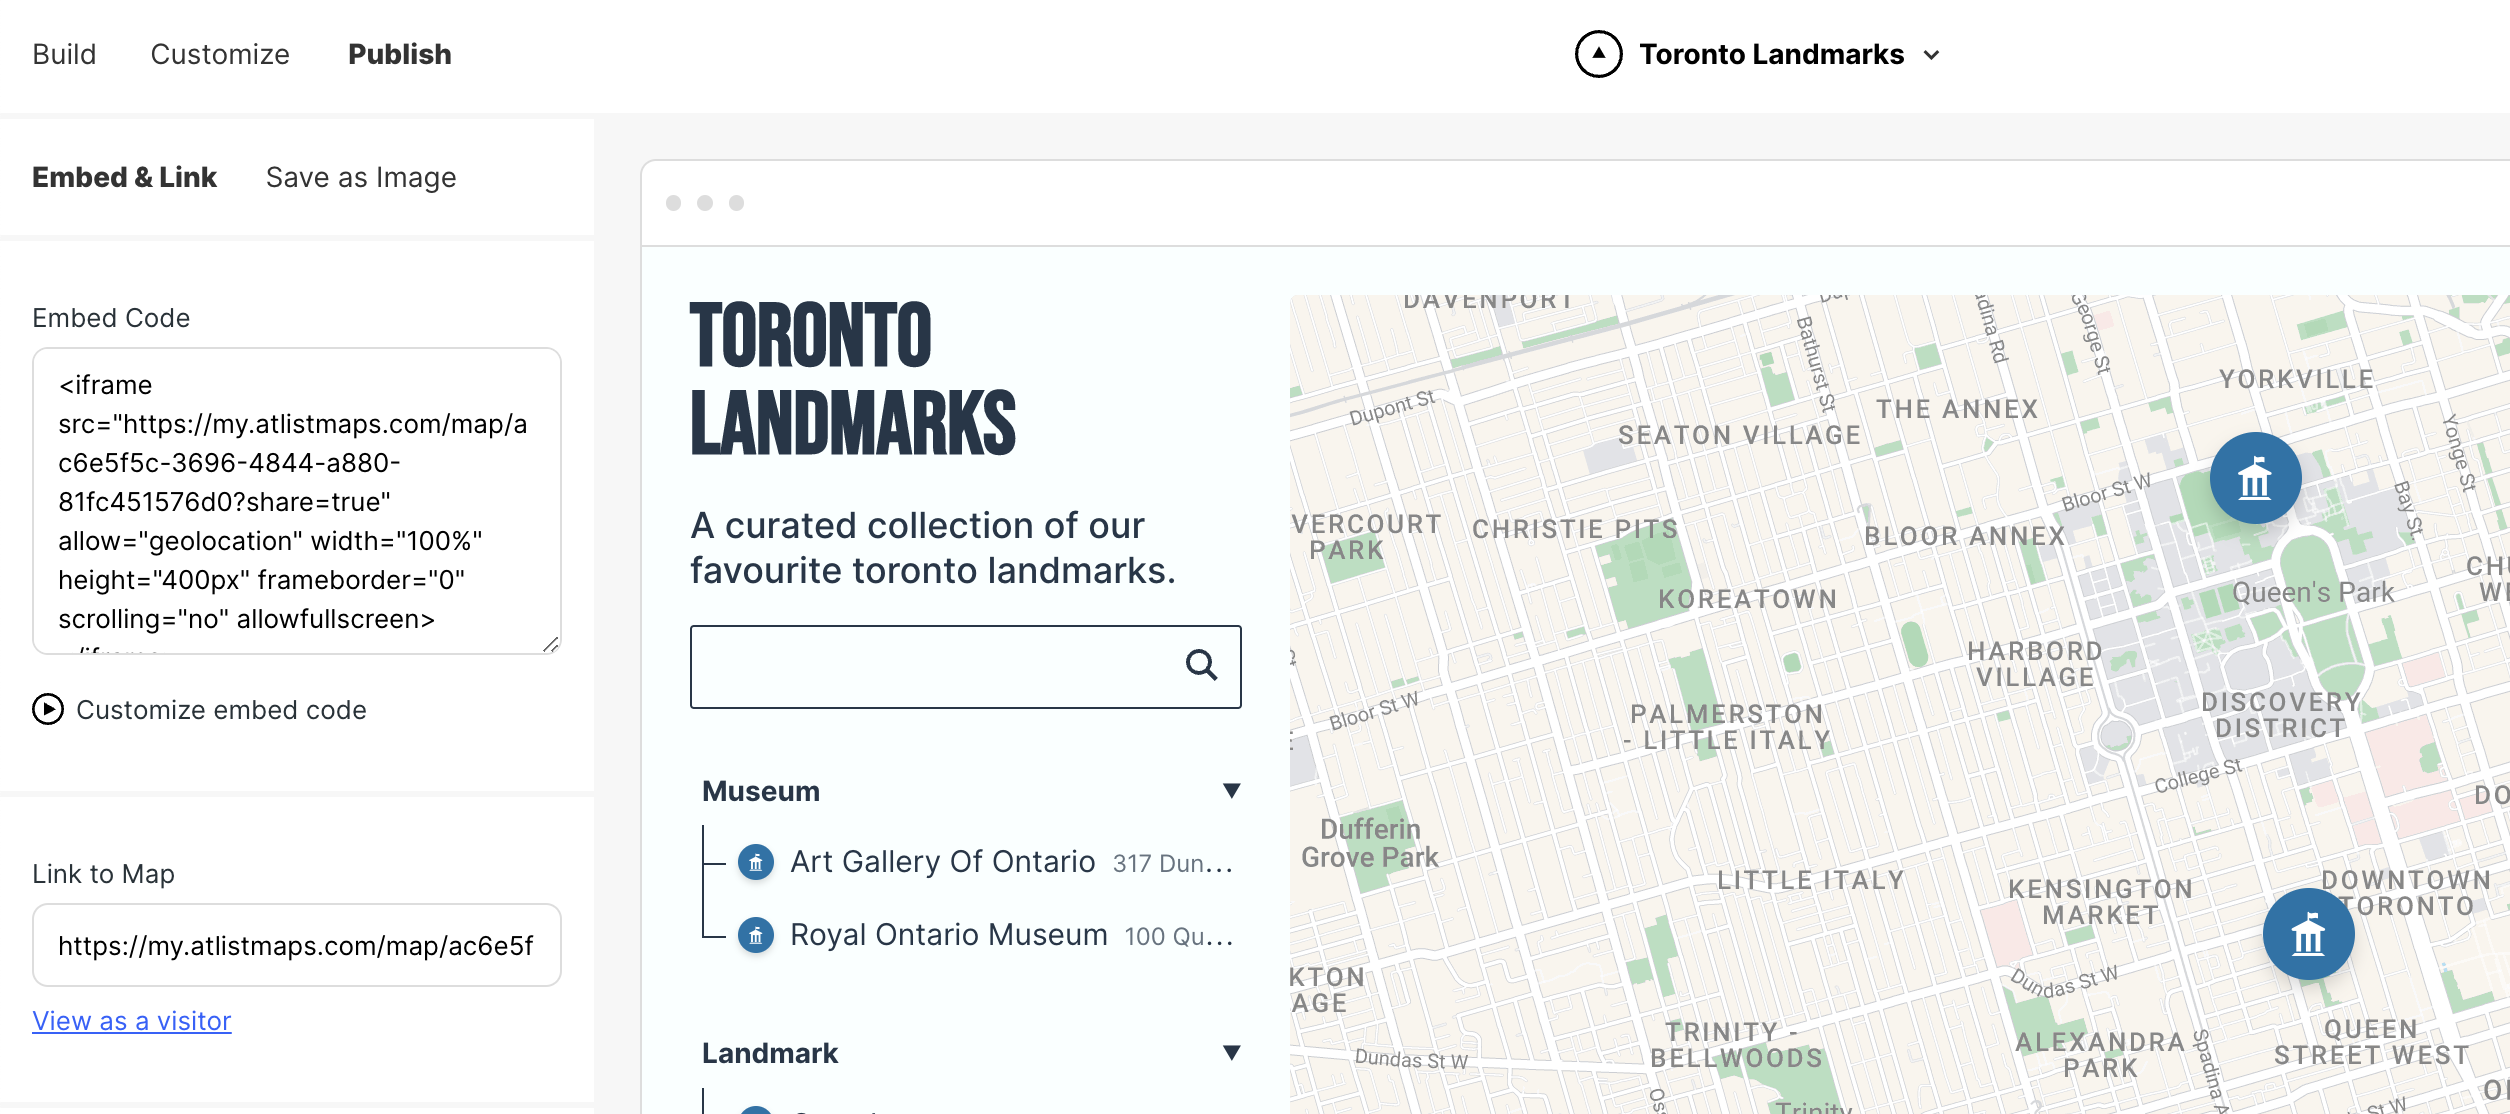
Here is an example of the embedded map:
FAQs
Is this using the Google Maps API?
Yes! Atlist uses the Google Maps Javascript API and Geocoding AP. You are not required to supply API credentials.
Are there other tools you’d suggest for plotting points?
There are many other tools and apps you can use to plot your data points. Google has its own map maker called Google My Maps. It’s free to use but doesn’t have very many customization options. Read more about its limitations.
How to plot multiple points at once on a map?
The easiest way is to upload an Excel Spreadsheet or Google Sheets spreadsheet by exporting it as a CSV. You can read this tutorial for more info.
.png)